Annotations
Annotations are a concept which ‘annotate’ or ‘flag’ a datapoint in a timeseries.
They help visualize metadata, such as events, at a given point in time. On the platform chart, an
annotation is shown as a flag on the datapoint it annotates, labelled
<channel>:<rule name>:<sequence number>. Hover over the flag to see the annotation's details:
- Annotation: the rule that created it and its sequence number (
<rule name>:<sequence number>). - Time: the timestamp of the annotated datapoint.
- Channel: the channel the datapoint belongs to.
- The annotation's properties, as a list of key-value pairs. In the example below these are the thresholds the spike validation rule used.
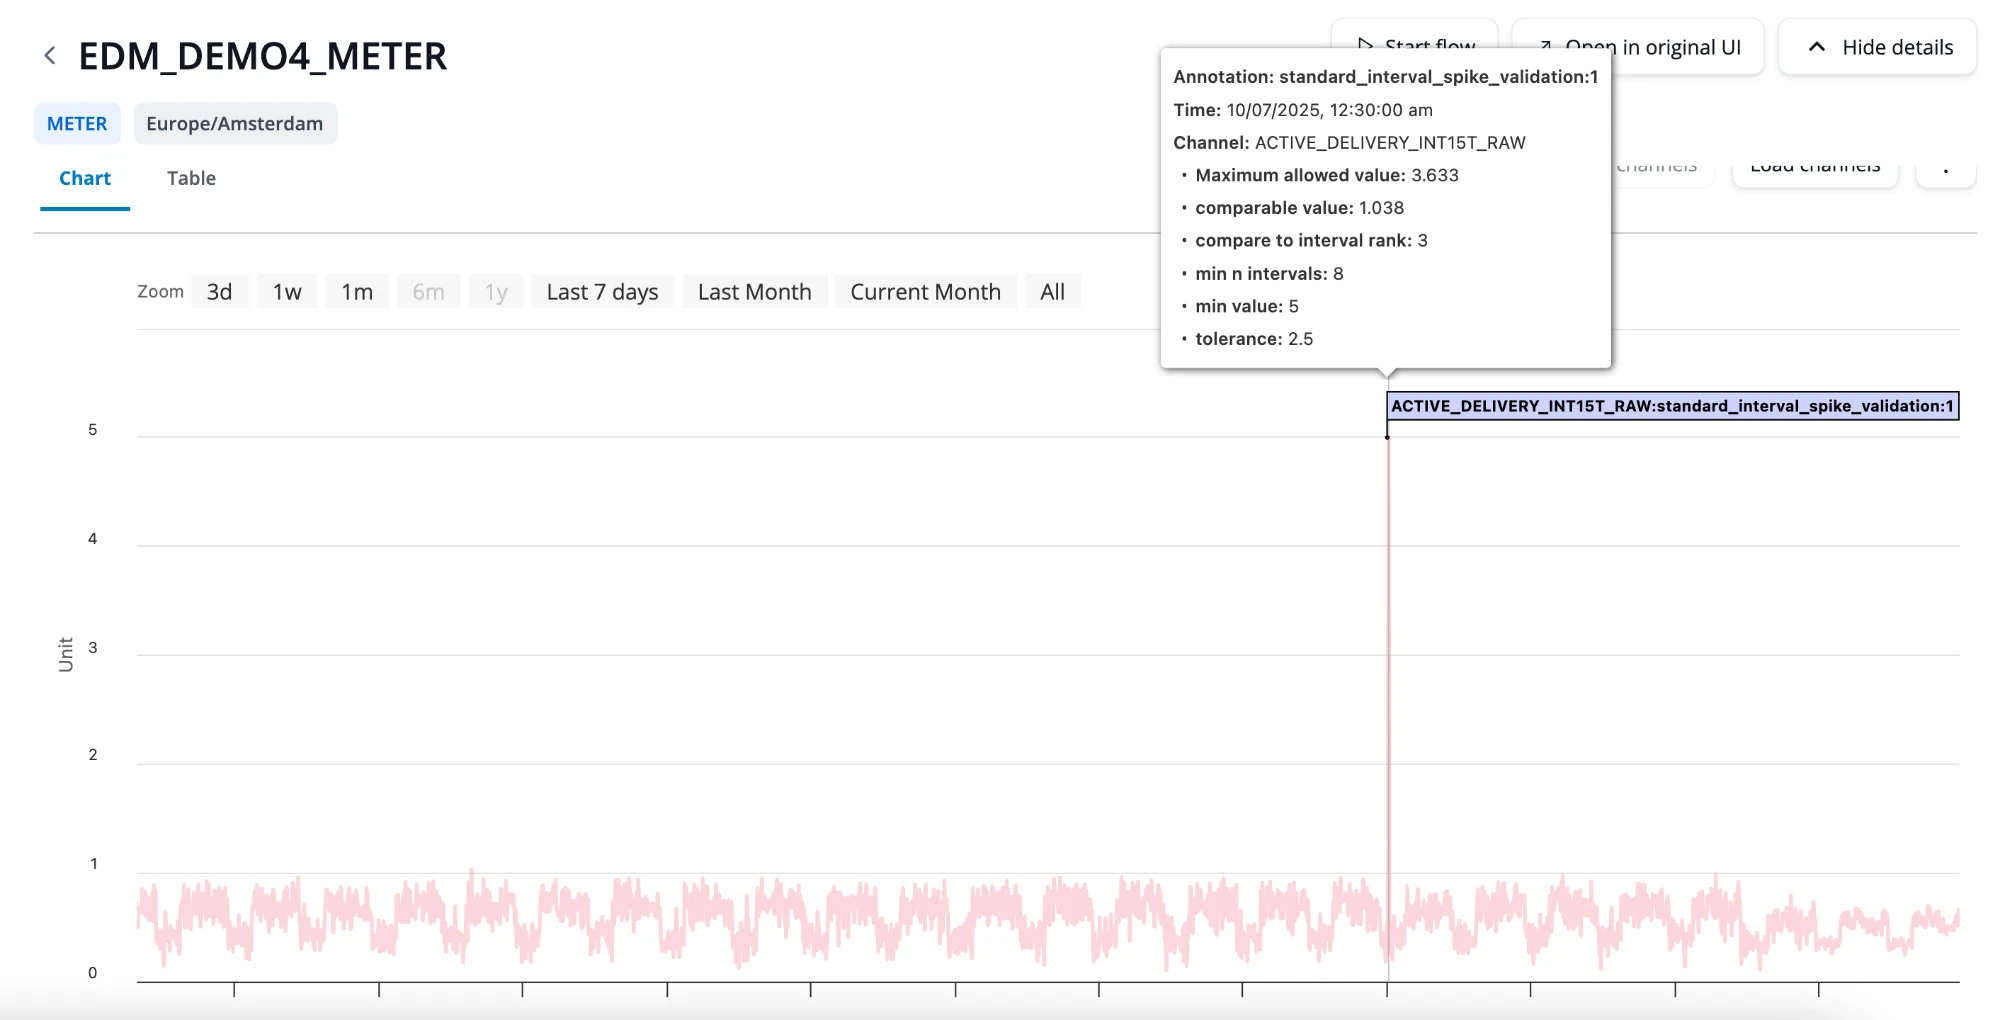
Annotation flags are hidden when the chart loads. The chart's Legend lists each channel's annotations under the channel, by rule name and sequence number, with the number of annotated datapoints in brackets. Click an annotation's name to show or hide its flags; hidden ones are greyed out. Click the coloured square in front of it to change the flag colour.
Annotations are central to the platform's data-quality process: validation rules flag suspect datapoints by annotating them (see Meter Reads Processing — VEE), and when a rule produces more annotations than its configured threshold, a task is created automatically for human follow-up (see Anomaly Detection and Alerting).
See more technical information in Storing Timeseries from Rules