EQL
1. What is EQL?
EQL (Energyworx Query Language) is your powerful tool for exploring and analyzing energy data. If you're familiar with SQL, you'll feel right at home—EQL uses the same straightforward syntax you already know, but it's specifically designed to work seamlessly with energy data and time-based information.
What can you do with EQL?
- Search and explore your data in real-time
- Create custom reports tailored to your needs
- Analyze process results and system performance
- Build dynamic, interactive dashboard visualizations
2. Where you'll use EQL
Advanced Search
Access powerful data exploration directly from your navigation bar, just click on the search section to get started.
Quick start video:
This video shows you how to search by ID, tags, and use advanced search features.
Dashboard Widgets
Create visualizations to monitor your energy data:
Available widget types:
- Lists - Display filtered data sets
- Statistics - Show key metrics with conditional formatting (highlight important values)
- Charts - Visualize trends with Area, Line, Column, or Stacked Column charts
- Tables - Present detailed data in an organized format
All widgets are built using EQL queries, giving you complete control over what data to display and how to present it.
Recipes: Save Time with Templates
Recipes are reusable query templates that make creating widgets faster and easier.
Benefits:
- Save your most-used queries as templates
- Share recipes with your team (available from version 24.04)
- Customize recipes with parameters for different use cases
3. What Data Can You Access?
EQL gives you access to all your essential energy platform data:
| Data Type | What It Contains | Why You'd Use It |
|---|---|---|
| Timeseries | Energy readings, measurements, and calculations over time | Track consumption, analyze trends, compare periods |
| Datasources | Information about meters, devices, and their channels | Understand your data sources, verify configurations |
| Latest Datasources | Most current version of all your meters and devices | Quick access to current configurations without historical versions |
| Flow | Process execution results and calculation outputs | Monitor system processes, verify data transformations |
| Audit Events | System activity logs and event history | Track changes, troubleshoot issues, maintain compliance |
| Generic | Custom data specific to your project | Access specialized data structures (contact support to enable) |
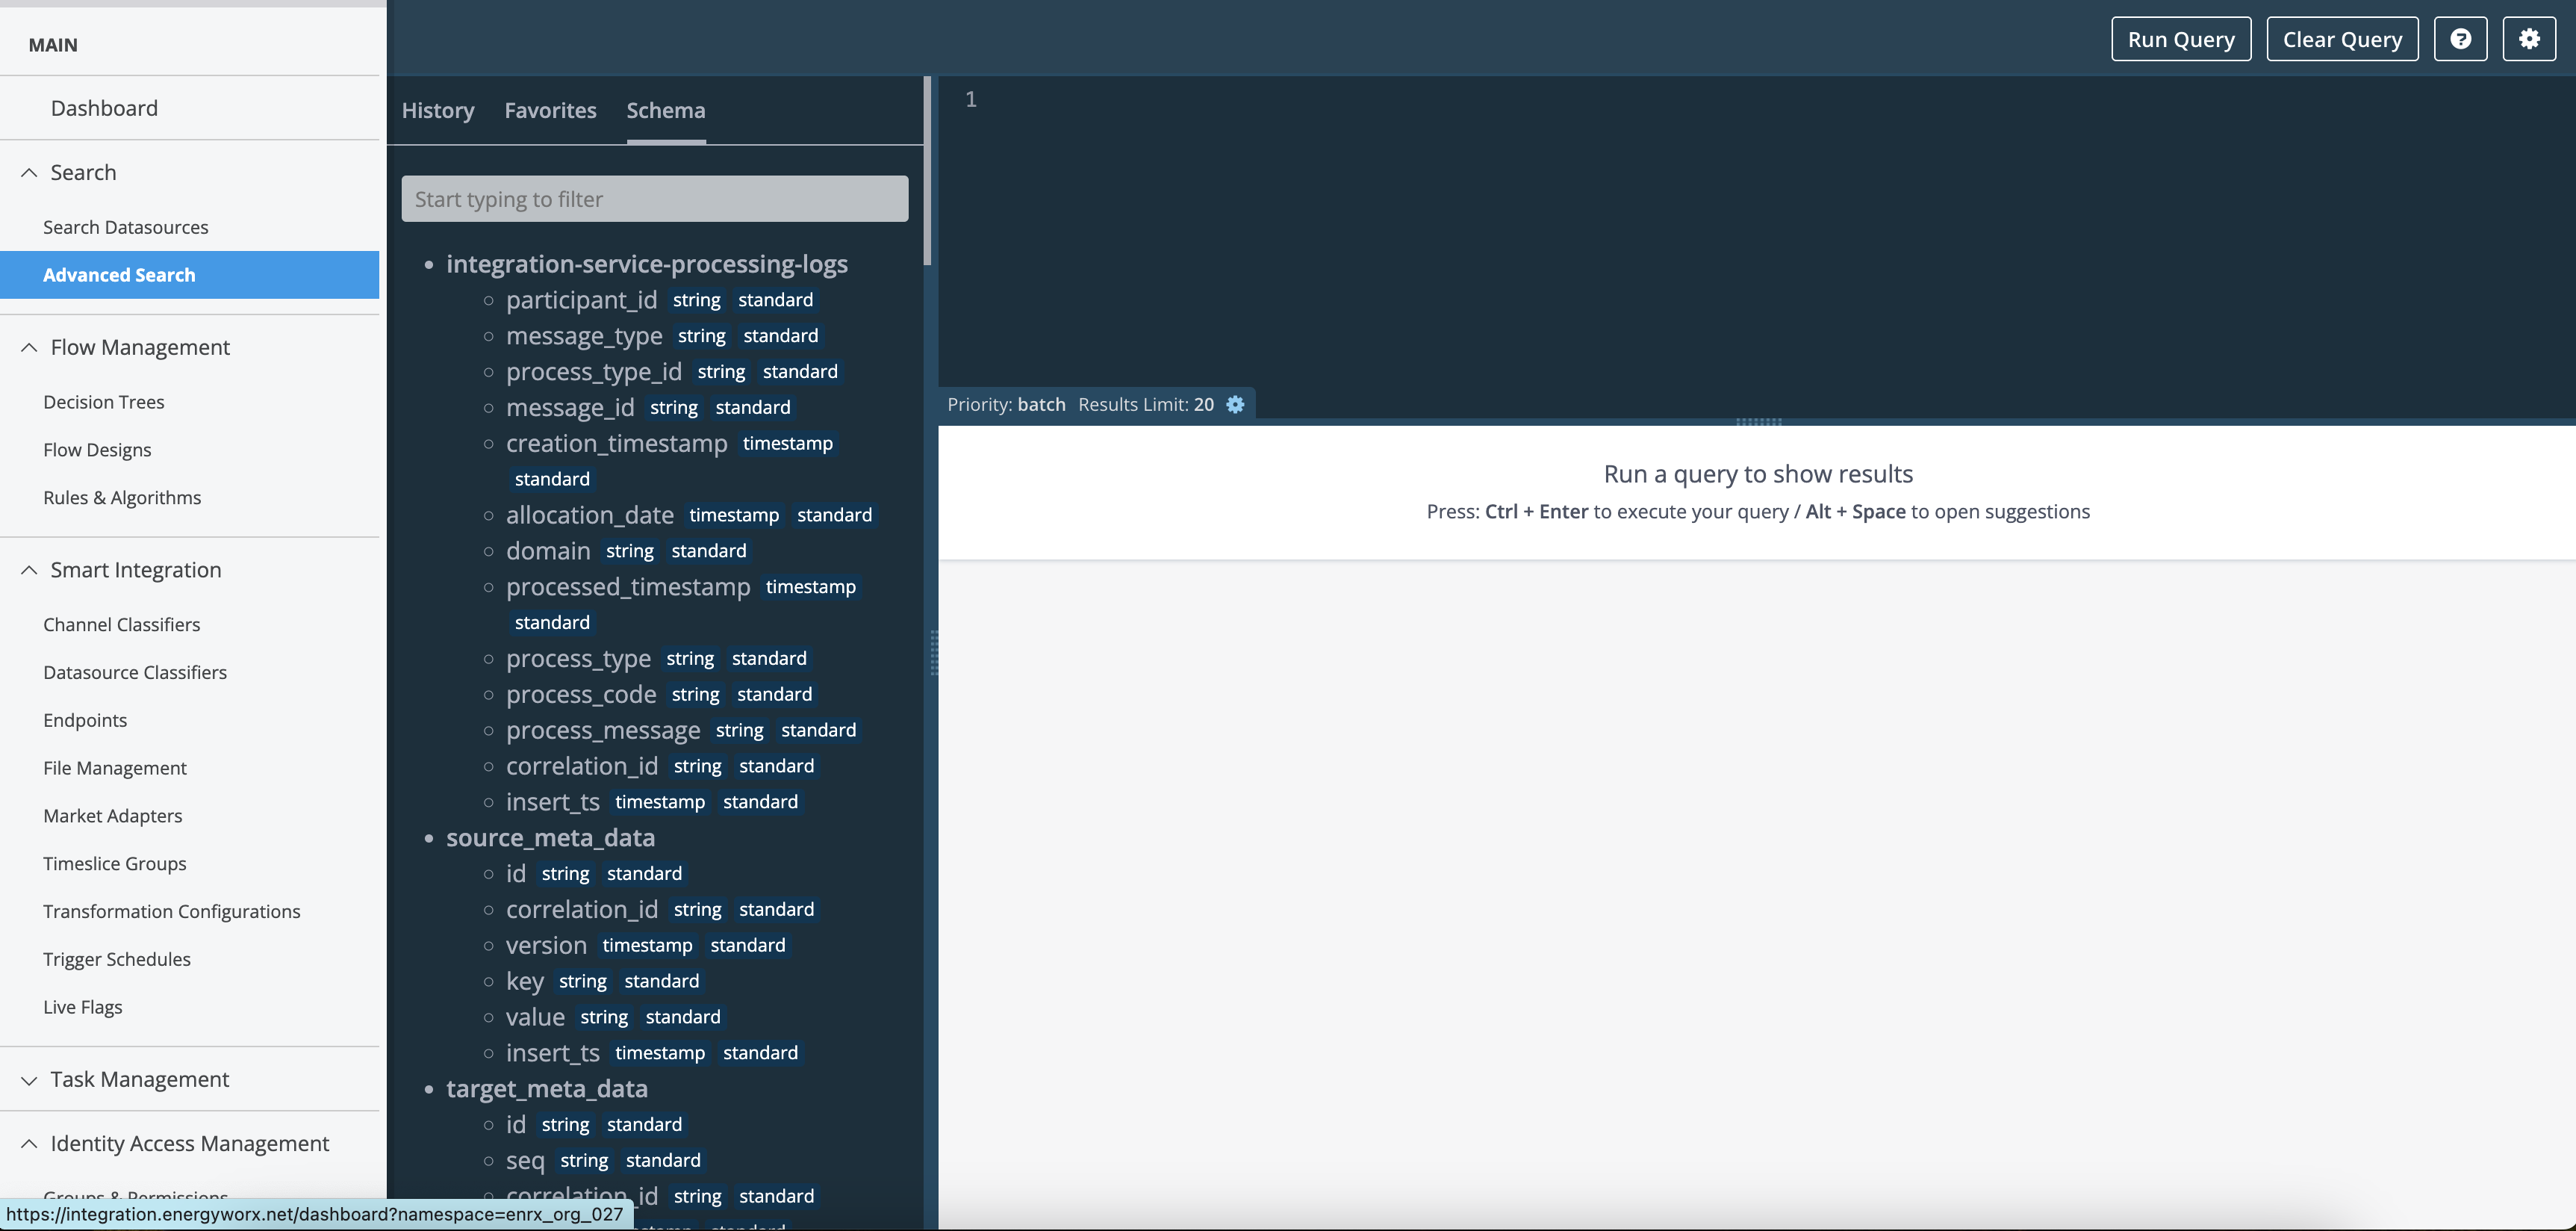
Tip: Explore the schemas tab in Advanced Search to see all available tables and their fields.
Date, datetime, and timestamp values in Advanced Search results are displayed exactly as stored in the database — no timezone conversion is applied. All data in the platform is stored in UTC (in both Bigtable and BigQuery), so the values you see in results will always be in UTC.
4. Query Reference
Understanding Your Data
EQL supports various types of data:
| Type | Examples | Use For |
|---|---|---|
| Numbers | 123, 45.67, 1000000 | Consumption values, costs, quantities |
| Text | "Building A", "Active" | Names, descriptions, status values |
| Dates & Times | 2024-01-15, 14:30:00 | Timestamps, date ranges, scheduling |
| True/False | Active/Inactive, On/Off | Status flags, conditions |
| Lists & Groups | Multiple values, nested data | Complex data structures |
Writing Queries
Here's the basic structure for an EQL query:
    SELECT [what you want to see]
    FROM [which table]
    WHERE [filter conditions]
    GROUP BY [how to group results]
    HAVING [group filters]
    ORDER BY [sort order]
    LIMIT [maximum number of results]
Example - Find high consumption meters:
SELECT meter_id, consumption
FROM timeseries
WHERE consumption > 1000
ORDER BY consumption DESC
LIMIT 10
Working with Historical Data
Important to know: By default, queries look back one year from today. This keeps your searches fast and efficient.
Need older data? That's possible as well. You can access historical data by specifying a date range using the insert_ts fields in your query.
Example - Query data from 2 years ago:
SELECT *
FROM tags
WHERE insert_ts >= '2023-01-01'
  AND insert_ts < '2023-12-31'
Need help? The Advanced Search interface includes built-in help with examples and syntax guidance. Click the help icon to access it anytime.