Dashboards for flow timings
How to create dashboards for flow timings
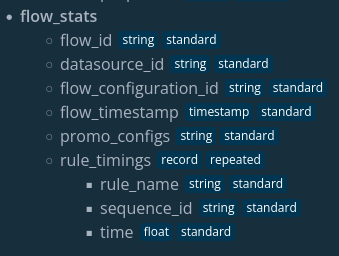
The flow_stats table contains information on the duration of every rule in a flow. The table contains the following fields:
- flow_id : the unique id of a specific execution of a flow
- datasource_id : the id of the datasource the flow was executed on
- flow_configuration_id : the id of the flow configuration
- flow_timestamp : the timestamp at which the flow was executed
- promo_configs : ids of all promo configs associated with the flow_configuration_id
- rule_timings : a collection of the execution times of the rules, contains three more fields
- rule_name : the name of the rule
- sequence_id : the sequence in which the rule was executed, in case a rule occurs in a flow more than once
- time : the amount of time it took to execute the rule in seconds
Since the rule_timings field is an array, it needs to be unnested before any of the fields inside the array can be filtered on. An example of this can be seen in the code block below.
Note before creating new dashboards
It is important to note that before this feature can work, the namespace needs to be bootstrapped. This is because the data is saved in a new table in BigQuery, and those can only be automatically created with bootstrap.
You can find a guide on how bootstrapping works //TODO Add reference to: bootstrapping.
Users can set up a dashboard to get more insight into their rules. One example of an eQL query for a dashboard that shows the average and maximum execution time per rule:
    SELECT
      rule_timings.rule_name,
      ROUND(AVG(rule_timings.time), 3) AS avg_time,
      MAX(rule_timings.time) as max_time
    FROM
      flow_stats
    CROSS JOIN
      UNNEST(rule_timings) AS rule_timings
    GROUP BY
      rule_timings.rule_name
    ORDER BY
      avg_time DESC
This can result in a widget that looks like this:
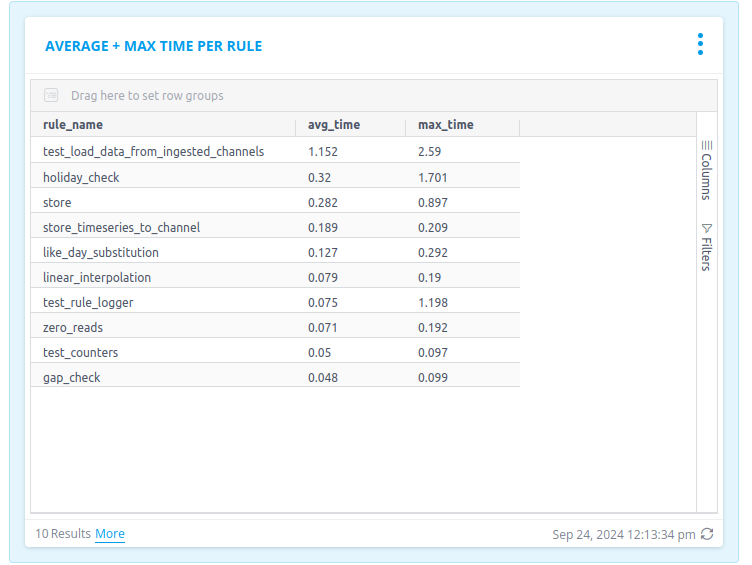
This could be further filtered to only show the rule timings for a specific datasource id, flow configuration id or even process monitoring configuration id.
This table and its dashboards tie in with the aforementioned Flow Execution Limit feature. This will warn the user if a flow or ingestion takes longer than 10 minutes, and was introduced in platform version 24.03. In a future release, the processing of the message will stop once the 10 minute deadline has been reached. By setting up a dashboard, users can easily see which rules took longest to execute, and can thus be improved.