Process Monitoring
Business Process Monitoring transforms how organisations oversee and optimise their platform operations by providing real-time visibility and actionable insights into their business process implementation's performance. This feature enables businesses to proactively manage their processes and reduce operational risks.
Key Benefits
- Enhanced Operational Visibility
- Real-time monitoring of business process execution status
- Clear insights into process performance metrics
- Immediate identification of process bottlenecks and failures
- Improved Risk Management
- Early detection of process anomalies
- Automated alerts for critical process deviations
- Operational Efficiency
- Quantitative metrics for process optimisation
- Reduced mean time to resolution for process issues
- Business Intelligence
- Trend analysis for process optimisation
- Evidence-based process improvement decisions
Core Features
- Comprehensive Metrics Suite : Track essential KPIs including success rates, processing times, and execution volumes
- Flexible Configuration : Customize monitoring for specific business processes and requirements
- Alerting System : Configure automated notifications for process anomalies
- Process Instance Tracking : Monitor individual process executions from start to finish
- 24-hour Performance Window : Rolling metrics collection for recent operational insights
Business Process Monitoring is the functionality to provide metrics over the processes running in the platform. The Business Process Monitoring feature enhances observability of the customer configured processes, providing insightful information during or after their execution. Metrics such as number of successful executions, number of failed executions, and earliest starting time of an executed process are available to increase the awareness of what has been executed in a particular period of time.
Note: this topic assumes reader knowledge of the overall working of the platform.
Definitions
A process is a set of configurations in the platform that allows the integration of a specific business purpose. For instance a BillingB2B process for capturing all the billings of the B2B customers will necessitate of a Market Adapter (MA) configuration, a Transformation Configuration, and perhaps a couple of Flow designs with its corresponding rules. This set of configurations is understood to work together to perform the BillingB2B process. Naturally, this process has a starting point, a process assignment , a place where the process itself starts by processing the data. In this particular example the starting point is the Market Adapter. Other processes may have other types of configurations assigned, the possible types that can be assigned to a process are listed later in this document.
A process instance is an execution of a process in the platform. In our example a process instance is the result of the ingestion of a file with the configured Market Adapter for that process. It is understood as an event that will affect the metrics of that process. A process instance is composed of several steps (process instance steps) which may differ for each process instance. For example, a particular file ingested for a BillingB2B process is validated successfully and executes a particular flow for calculating the Billing. A different file for the same process instead causes an error validation skipping the operations for the Billing calculation and thus not executing that flow. In the former scenario a MA step and a Flow step have been executed, in the latter only the MA step is executed.
Process metrics are the different metrics that can be calculated for a particular process. The Energyworx platform provides a set of metrics that can be calculated for each configured process. The available metrics are described later in this document.
BusinessProcess Monitoringalerts are notifications triggered by the Energyworx platform when a specific condition is met. This notification serves to inform or warn designated recipients about a situation that requires their attention or action. The notifications are sent by email to the corresponding recipients.
Business Process Monitoring configurations
In order to monitor a particular process, the user first needs to create a Process Monitoring configuration in the platform. With this the platform is aware of which executions need to be tracked to calculate the metrics.
A Business Process Monitoring configuration needs to have an identifier given by the user. The identifier must contain letters, numbers, or the characters - or _. A display name and description can also be added.
The user must then select a minimum of one assignment. The possible process assignments are explained in the next section.
Process Assignments
A limited set of platform configurations can be assigned to a Process Monitoring configuration. The following table shows which configurations can be assigned to a Process Monitoring config.
| Configuration Type | Platform version |
|---|---|
| Market Adapter | ≥24.02 |
| Flow design | ≥24.02 |
The user can select among all available configurations for those types available in the working namespace.
Do note that if a particular process instance executes over more than one process assignment, only the first assignment will be used for the metrics calculations and the subsequent assignments will be discarded.
For example, if a user assigns Market Adapter A and Flow design X to a process called Billing, and a particular execution of such a process, i.e., a process instance, uses both Market Adapter A and Flow design X, only the Market Adapter A will be used for calculations.
Process instance steps
A process instance is composed of several steps. One step is at least always executed for each process instance. These steps represent different stages of the platform processing the incoming data. The following steps are defined:
| Process instance step | Description | Platform version |
|---|---|---|
| Market Adapter | This step comprises the ingestion of a file and creation/update of the different data models (datasource, tags, channels, etc.) | ≥24.02 |
| Flow | This step comprises the execution of a flow design | ≥24.02 |
The number and type of steps may differ for each process instance. For example, a particular file ingested for a BillingB2B process is validated successfully and executes a particular flow for calculating the Billing. A different file for the same process instead causes an error validation, skipping the operations for the Billing calculation and thus not executing that flow. In the former scenario a MA step and a Flow step have been executed, in the latter only the MA step is executed.
Process instance status
A process instance may be in different status throughout its lifetime. This status will be reflected in the metrics to give an overall view of how a certain process is behaving at a given time. For example, a user can create a Process Monitoring config and assign a specific Market Adapter so it can be seen how many file ingestions using that Market Adapter have been successfully finished so far and how many are still in progress.
The following process instance statuses are defined in the platform:
| Process Status name | Description |
|---|---|
| Completed | All operations for that process instance have been finalized |
| Aborted | An error occurred during the execution of customer code |
| Failed | An error occurred during the execution due to external factors (i.e. database not available) |
| In progress | At least one operation of the process instance has not been finished yet. |
The following errors trigger an Aborted state:
| Error Type | Platform area |
|---|---|
| FlowCancelException | Flow execution |
| FlowException | Flow execution |
| Any exception | Transform |
The following errors do not trigger an aborted state, they don't affect the status of the process instance
| Error Type | Platform area |
|---|---|
| FlowRuleException | Flow execution |
| SequenceCancelException | Flow execution |
A process instance is considered failed or aborted if any of its process steps has failed or has been aborted.
Metrics
Users can select which metrics to be calculated for a configured process. The following table shows which metrics are available:
| Metric name | Description | Platform version |
|---|---|---|
| Total instances | The total amount of instances executed for this process | ≥24.02 |
| Successful instances | The successful amount of instances executed for this process | ≥24.02 |
| Failed instances | The failed amount of instances executed for this process | ≥24.02 |
| Average duration | The average duration of process instances for this process (including failed instances) | ≥24.02 |
| Process duration | The total process duration, taking into account all the process instances duration, i.e. how long it takes for a process instance to finish, including any queueing time | ≥24.02 |
| Cumulative processing time | The time spend in real processing, without queueing time | ≥24.02 |
| Start time | The start time of the first process instance of this process | ≥24.02 |
| End time | The end time of the first process instance of this process | ≥24.02 |
NOTE: For platform version 24.02 all these metrics are based on a 24h sliding time window. All process instances will be stored for 24 hours, therefore, all metrics will have into account all process instances that have been executed during the last 24 hours since the metrics request in the UI.
NOTE : The metrics collection begins only after configuration, not retroactively.
Process Monitoring Alerts
The Alerts functionality allows the user to monitor the performance of your Business Process Monitoring configurations and receive email notifications when specific conditions are met. To set up a monitoring alert, the user needs to define the following:
- Alert Name: A descriptive name for the alert.
- Description: Optional field for the description of the alert.
- Metric: The performance metric to monitor (see the table below for available metrics).
- Operator: The comparison operator used to evaluate the metric against the threshold (e.g., greater than, less than).
- Threshold Value: The numerical value used as a threshold for triggering the alert.
- Alerting Schedule: The time(s) at which the system should check the alert condition.
- Destination Emails: A list of email addresses to receive alert notifications.
Once configured, the system will evaluate the chosen metric at the specified schedule. If the condition defined by the metric, operator, and threshold value is met, an email notification containing details about the condition and the corresponding Process Monitoring configuration will be sent to all designated recipients.
The following table specifies the available metrics and operators for Process Monitoring.
| Metric name | Operators | Platform version |
|---|---|---|
| Total instances | ≥,≤ | ≥24.04 |
| Successful instances | ≥,≤ | ≥24.04 |
| Failed instances | ≥,≤ | ≥24.04 |
| Processing Time Span | ≥,≤ | ≥26.01 |
Limitations
- The alerting schedule can never be a frequency higher than 5 minutes.
- The email delivery time does not depend on the Energyworx platform alone. Network traffic and external services that are used to delivery the emails may impact the notification service.
Usage in the platform
To be able to track a process on the platform, first we need to create a Process Monitoring configuration. This is done in the Process Configurations section of the Energyworx platform.
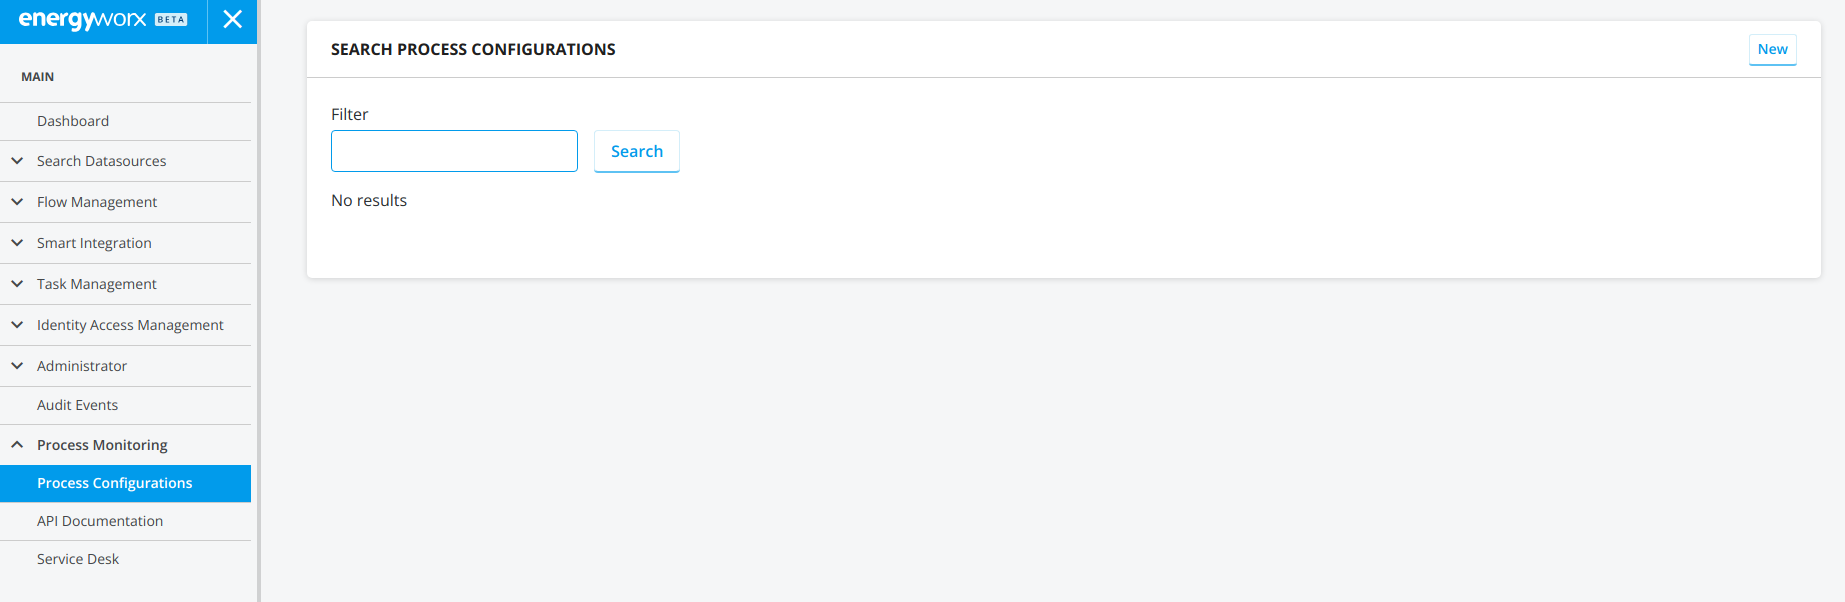
To create a new Business Process Monitoring configuration, click on the button New and it will bring you to the next page:
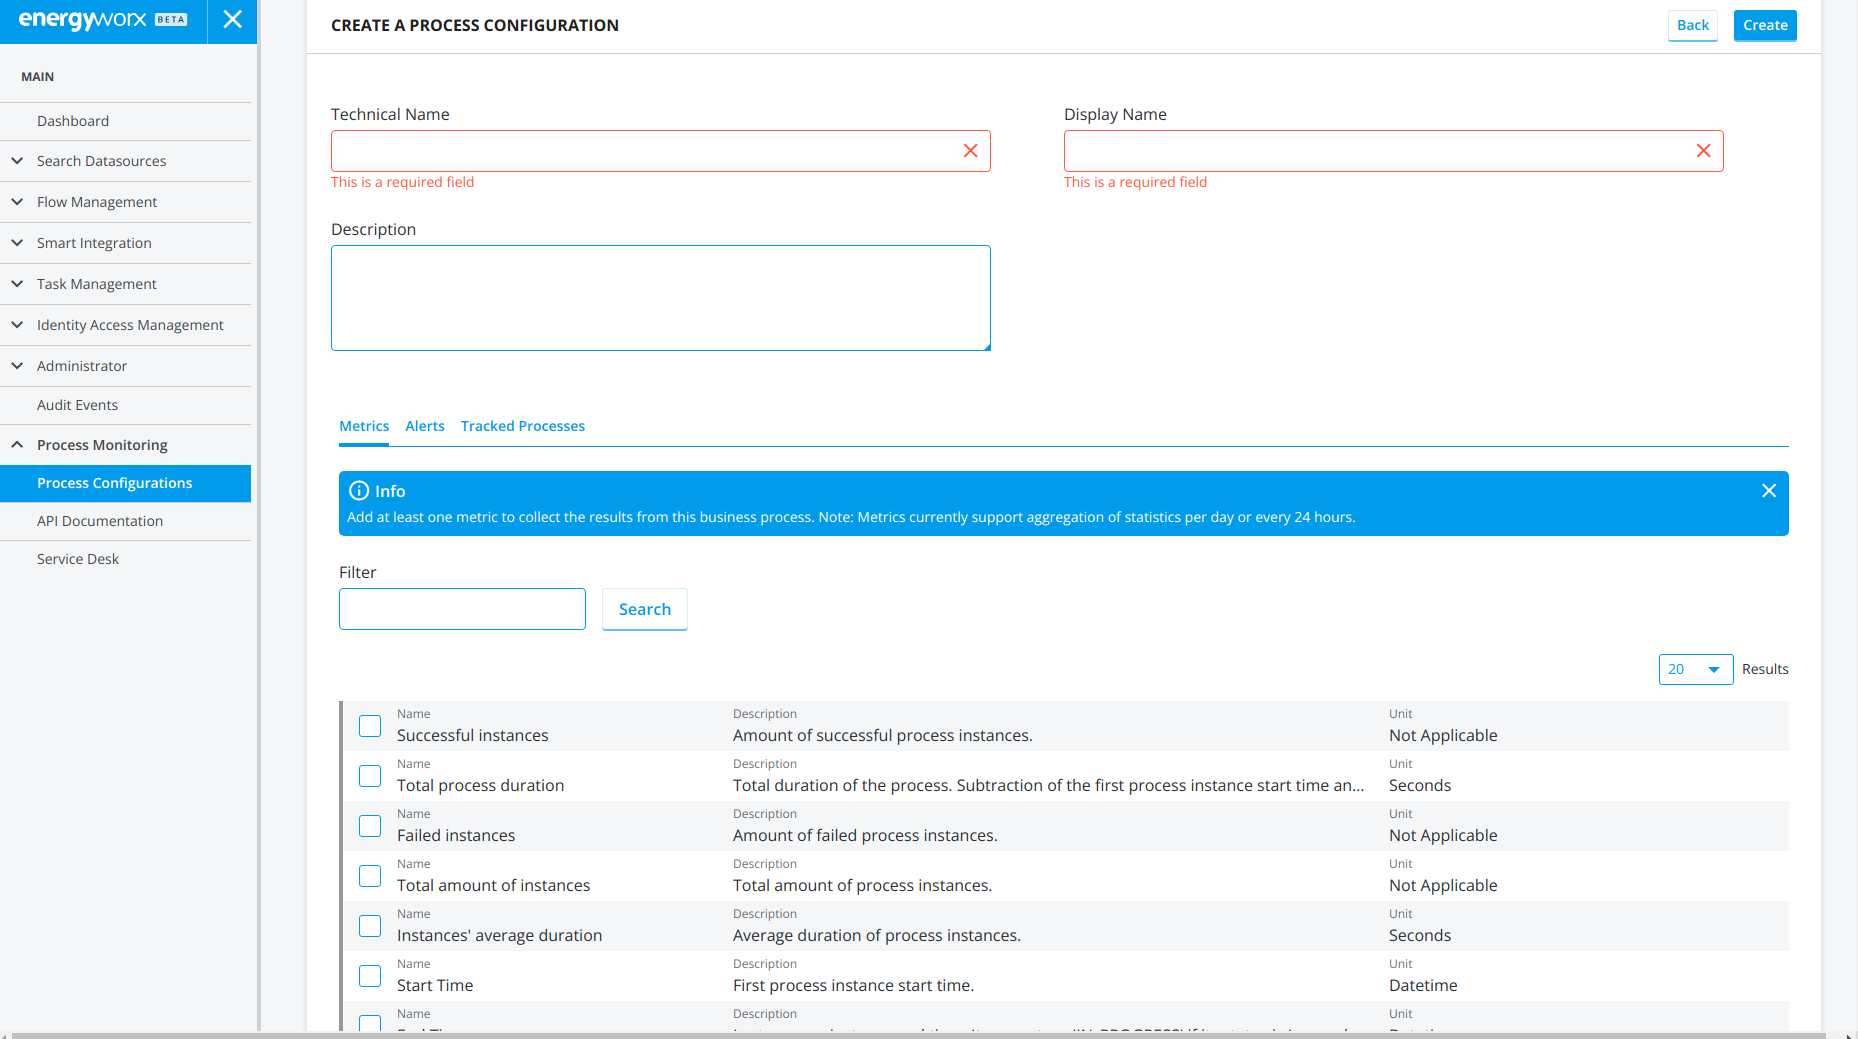
There you can fill the Technical name, the display name (mandatory fields) and the description. The following rules apply:
- The technical name must contain only letters, numbers, and the symbols - and _. It's the identifier for the platform.
- The technical name must be unique within the current namespace. An error will be shown when saving the Process Monitoring config if this is not satisfied.
- The display name does not have limitations in allowed characters.
- The technical name can be changed after the Process Monitoring config is created, but the metrics values will be reset.
- The display name can always be configured at will.
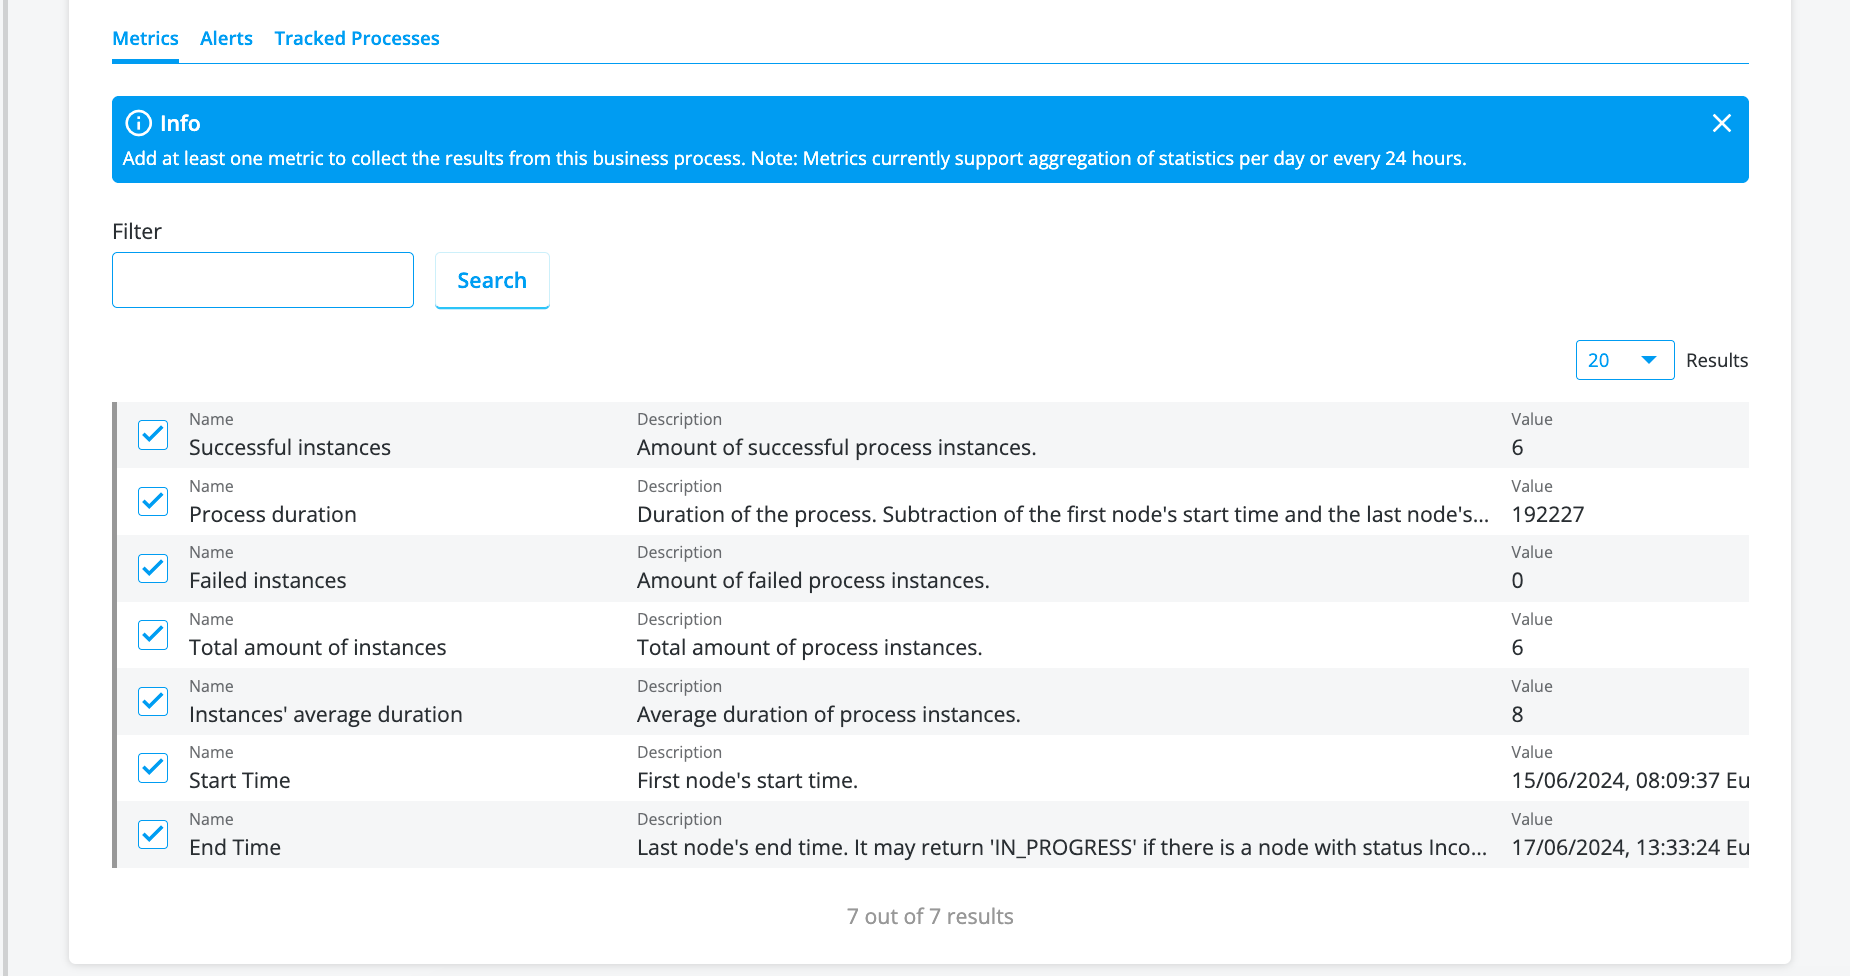
Then we can choose the metrics we want to observe by checking on any of them in the Metrics tab.
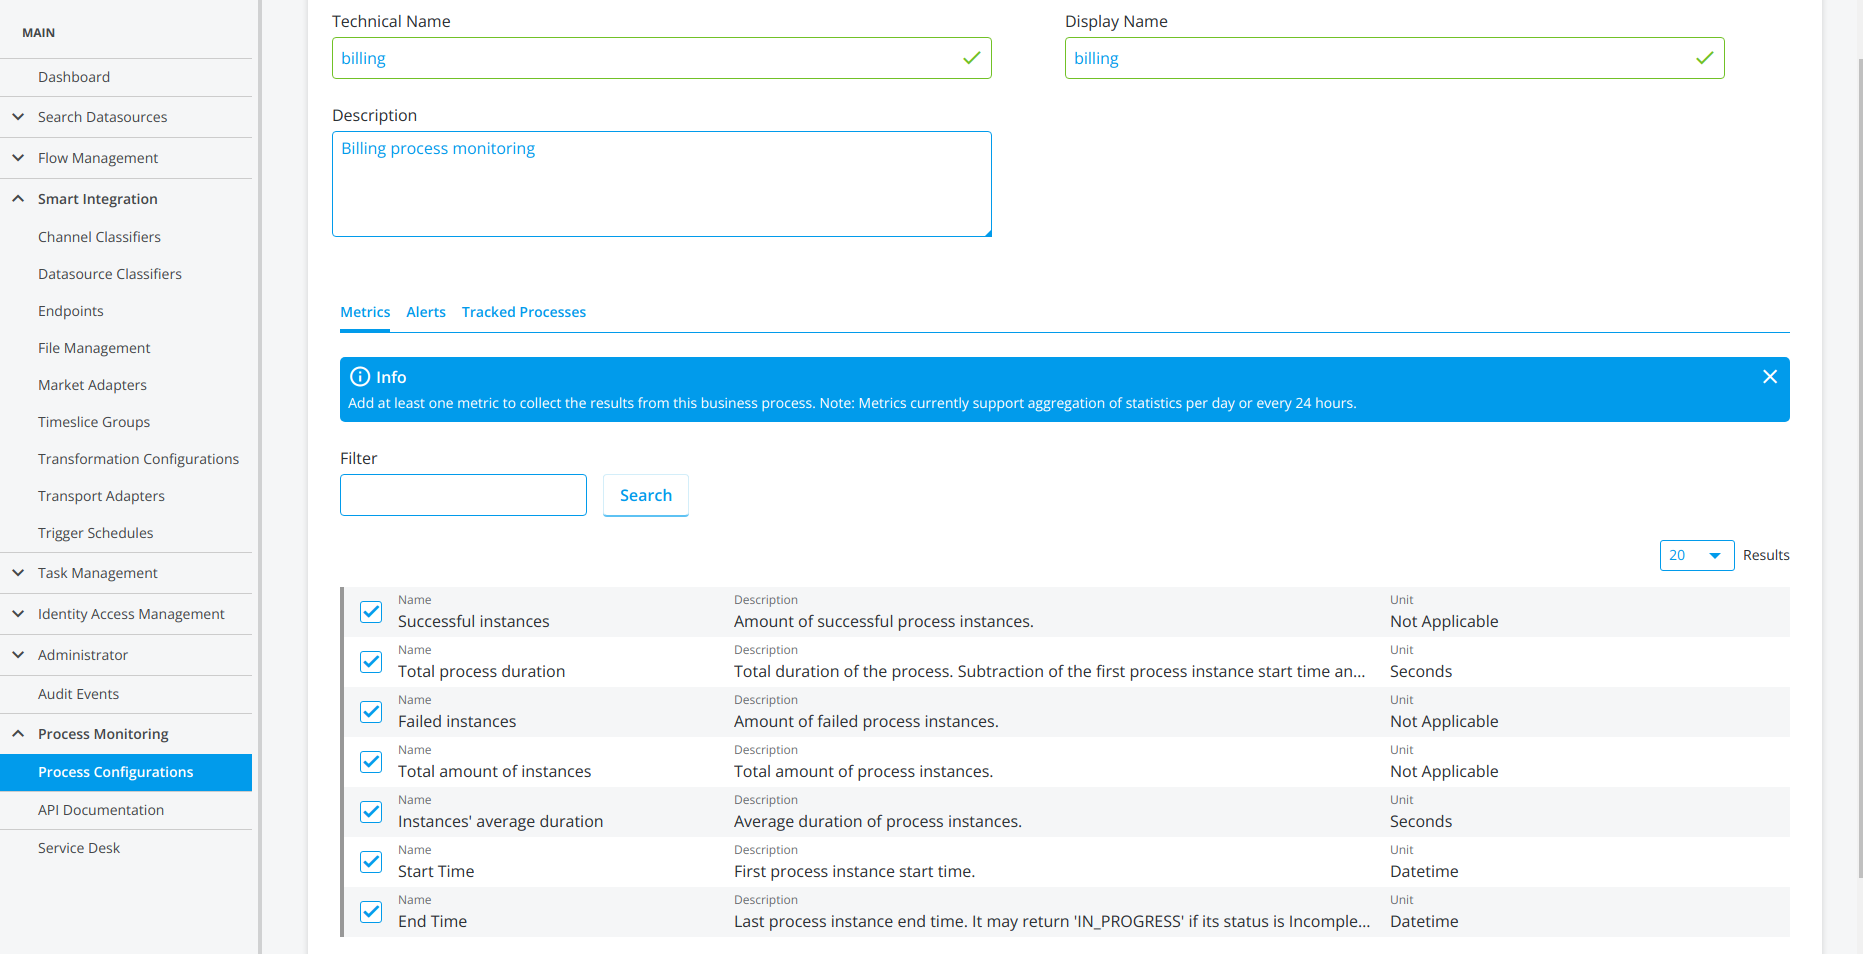
The last step is to assign a configuration in the platform will be tracked by this Process Monitoring configuration, i.e., which Market Adapters, Flow configurations, etc. belong to the corresponding business process. For that click on the tab Tracked Processes and choose them. For instance, in this picture it is shown the Market Adapters that can be chosen.
A Process Monitoring config always needs at least one assignment in order to be created.
Finally, we only need to save the configuration, and it's ready to start collecting data for the metrics.
The metrics can be viewed later in the listed Process Monitoring configuration. It will show something like this:
To configure Business Process Monitoring alerts on an existing Monitoring config, you need to click on the edit button of the Process Monitoring config and go to the alerts tab. Then you can click on Add alert.
Then a tab will open with the corresponding fields to be filled in:
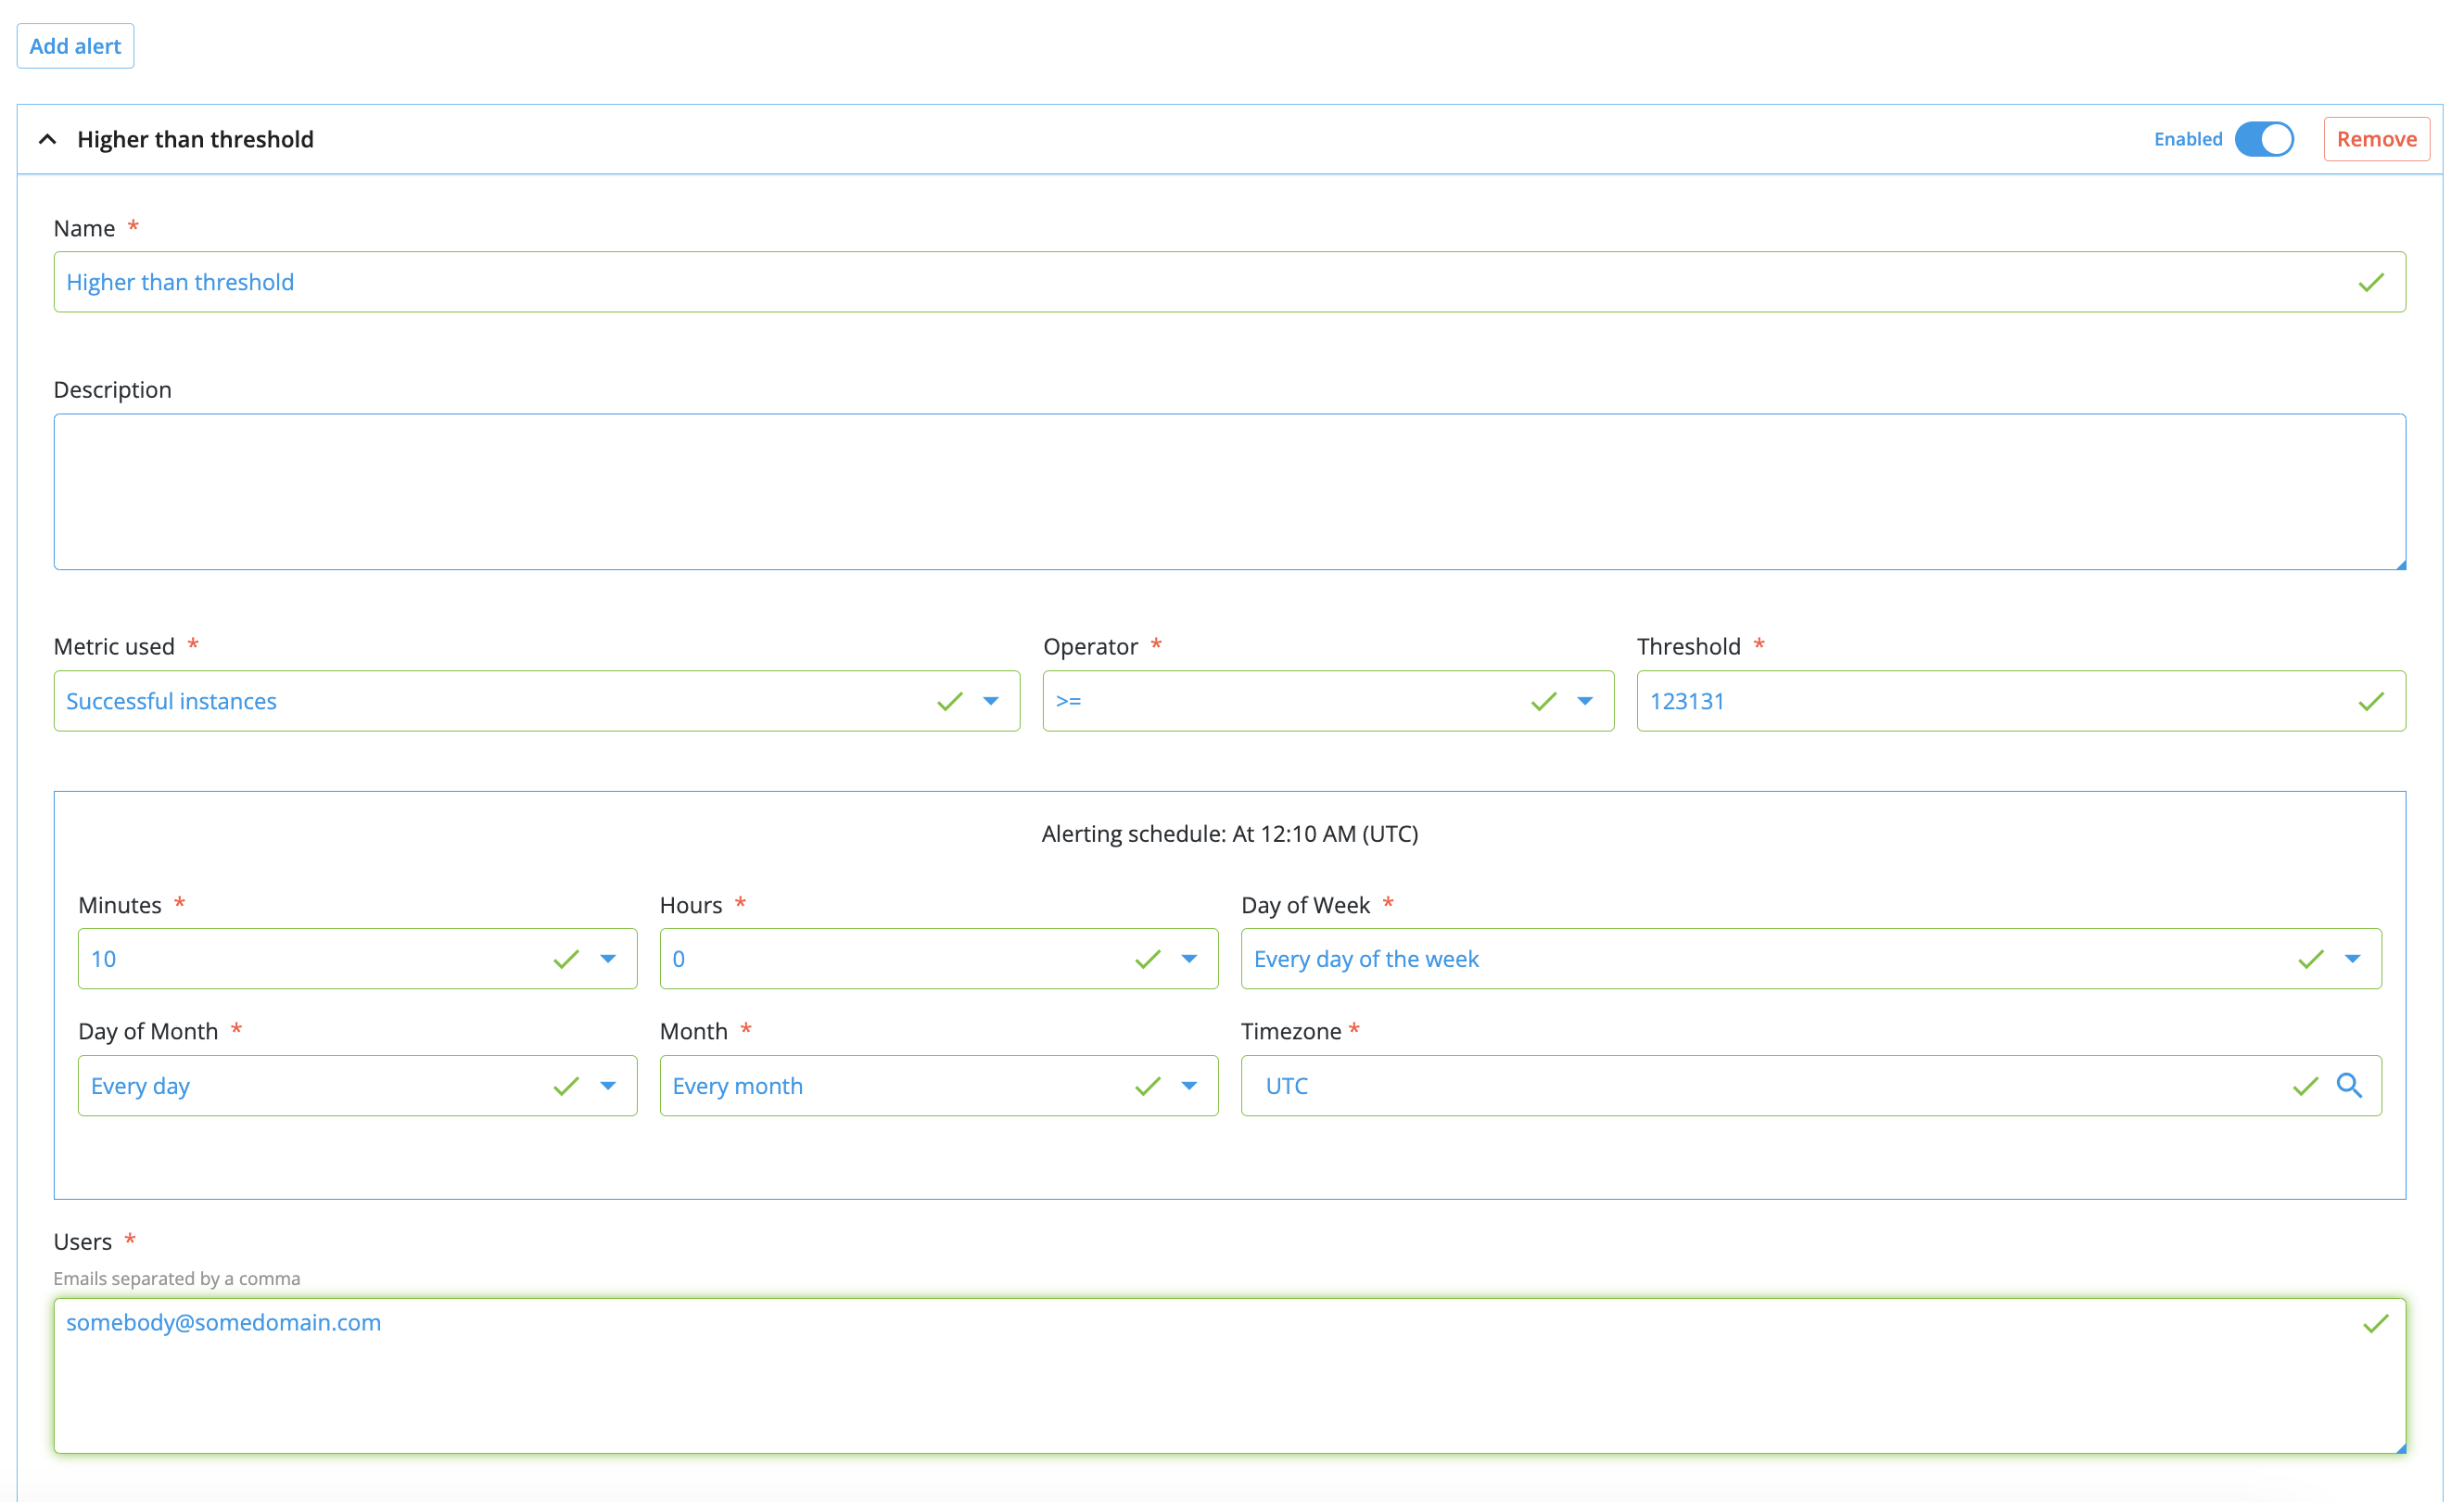
Note that the destination list is a comma-separated list. The contents must match an email format.